
How To Test A Fiber Optic Cable: The Complete Field Guide
Nov 09, 2026
Leave a message
TL;DR: Knowing how to test a fiber optic cable comes down to four moves: check continuity with a visual fault locator, inspect and clean the connector end faces, measure insertion loss with a light source and power meter, and compare the reading against your loss budget. Add an OTDR when you need the exact fault location. This guide shows how to test a fiber optic cable, which numbers count as a pass, and the traps that fail good cables.
Quick answer: To test a fiber optic cable, (1) shine visible light through it with a visual fault locator to spot breaks and sharp bends, (2) inspect and clean both connector end faces against IEC 61300-3-35 criteria, (3) measure insertion loss with a light source and power meter at the link's working wavelength, (4) compare the measured loss to your calculated loss budget, and (5) run an OTDR trace when you need distance-to-fault or splice-level detail. A real pass is a stable reading inside budget, not just a number under a limit.

An SC single-mode patch cord with a factory test label: the insertion loss data on the label serves as the primary evidence regarding "end-face and manufacturing quality.
If you're wondering how to test a fiber optic cable, here is the whole method up front: shine visible light through the fiber to spot breaks, inspect and clean the connector end faces, measure insertion loss with a light source and power meter, then compare the reading against your loss budget. Run an OTDR when you also need to know exactly where the problem sits along the cable. Those four checks catch the faults behind most fiber outages, and none of them takes more than a few minutes once you know the routine. The same routine works on a two-meter patch cord and a 40 km buried trunk.

AQ7270 OTDR field measurement interface: parameters such as measurement range, pulse width, wavelength, and refractive index can all be verified on the front panel.
The order matters. Contamination of connector end faces is the leading cause of fiber network failures, which is why inspection comes before any meter reading. And testing costs almost nothing next to the alternative: high-impact outages now carry a median cost of $2 million per hour, according to New Relic's 2026 Observability Forecast.
We write this from the production floor, not from a desk. Our factory turns out fiber patch cords and MPO assemblies every day, and our quality control process tests them before they ship. After 20 years in this industry, we can tell you the most common reason a good cable "fails" a test is the test method itself. So this guide covers the steps, the numbers, and the traps.
1.Why Should You Test a Fiber Optic Cable Before It Fails?
You test a fiber optic cable to catch hidden faults before they stop traffic: dirty end faces, tight bends, bad splices, and breaks all hide inside a cable that looks perfectly fine. Fiber carries light you can't see, so a passing test is the only proof a link will work.

Copper cable gives you hints when it's in trouble. Fiber doesn't. A hairline crack or a dusty ferrule looks identical to a healthy link from the outside, right up until the moment errors start. That's why every serious installer tests twice: once before the cable goes into service, and once whenever something changes.
The stakes keep rising too. Networks run faster every year, and faster links tolerate less loss, so a connector that passed five years ago can fail today's gear. When the link carries a production floor or a data center row, downtime is measured in money, and the median cost of a high-impact outage has reached $2 million per hour. A 20-minute test is the cheapest insurance you'll ever buy on a network.
Testing also isn't a one-time event. A cable's life has three checkpoints: on the reel when it arrives, at handover after installation, and every time something changes nearby (a rack move, a new panel, a "quick" re-patch). Each checkpoint uses the same few methods this guide covers, which is why they're worth learning properly once.

2.What Are the Main Ways to Test a Fiber Optic Cable?
There are four main ways to test a fiber optic cable: a visual fault locator (VFL) for quick break and bend checks, an inspection scope for end face cleanliness, a light source and power meter (OLTS) for insertion loss, and an OTDR for a full map of the link with fault distances. Each one answers a different question.
|
Method
|
Question it answers
|
Speed
|
Tells you distance?
|
Best for
|
|
Visual fault locator (VFL)
|
Is the fiber broken or badly bent?
|
Seconds
|
Visually, short range
|
Quick checks, finding the right fiber
|
|
Inspection scope
|
Is the end face clean and undamaged?
|
Seconds
|
No
|
Before every connection
|
|
Light source + power meter (OLTS)
|
How much light gets lost end to end?
|
Minutes
|
No
|
Acceptance and certification (Tier 1)
|
|
OTDR
|
Where is every event on the link?
|
Minutes
|
Yes
|
Long links, splices, troubleshooting (Tier 2)
|
Start with the cheapest tool that answers your question. A visual fault locator injects bright red 650 nm light into the fiber, and that light glows through the jacket at a break, a kink, or a bad connector. It's the tool you'll reach for most often, and it costs less than lunch. Just remember what it can't do: it gives no numbers, it can't see through black jackets, and a splice that looks fine at 650 nm can still lose signal at 1310 or 1550 nm.
For anything that matters, the insertion loss measurement with a light source and power meter is the test that decides acceptance. The Fiber Optic Association (FOA) calls it the most important test of an installed cable plant, and every international standard requires it before handover. We'll walk through it step by step in the next section.
So how do you choose? Match the tool to the question you're actually asking. If a user says "this port is down," start with a VFL and a look at the end faces; you'll solve most short-range problems in minutes. If you're handing over a new installation, the OLTS loss test is the deliverable, with an OTDR trace alongside it on longer runs. And if you're buying cable, ask for the supplier's factory test data before the cable ever reaches your dock. A surprising share of "bad cables" never pass a single test before they ship, which is exactly why our quality control process tests every assembly instead of sampling.
One more habit worth building: test your test gear first. Bad reference jumpers and dirty equipment connectors cause more false failures than bad cable does. The FOA recommends testing every reference jumper before field work, and we second it from experience.
3.How Do You Test a Fiber Optic Cable With a Light Source and Power Meter?
To test a fiber optic cable for loss, clean the connectors, connect a light source to one end and a power meter to the other, record a reference reading (P0) through a short jumper, then measure through the cable itself (P1). Loss equals P0 minus P1, and you compare that number to your loss budget.

Appearance of the handheld stabilized light source; the front panel features a wavelength selection switch (1310nm/1550nm) and an output port.
Here's the full procedure. Two people make it faster, one at each end.
Clean everything. Both connector ends on the cable under test, both reference jumpers, and the adapters. Dirt is the number one false failure.
Set the reference. Connect the light source directly to the power meter through a known-good jumper and record the reading, for example -5.0 dBm. That's P0, your zero-loss baseline.
Match the wavelength. Test single-mode fiber at 1310 or 1550 nm, multimode at 850 or 1300 nm, whatever the link actually runs. A wrong wavelength skews the result by several dB.
Connect the cable. Light source to one end, power meter to the other, through the cable under test.
Read P1 and calculate. Loss (dB) = P0 - P1. If P0 was -5.0 dBm and P1 reads -13.5 dBm, the cable loses 8.5 dB.
Compare against the budget. More on that in the next section.

Prefer to see the method performed end to end? This lecture from the Fiber Optic Association, the same source we cite for the standards below, walks the reference-jumper procedure on camera:
Video: FOA Lecture 16, Insertion Loss Testing, courtesy of the Fiber Optic Association (15 minutes, 50 seconds). If the player doesn't load, watch it on YouTube.
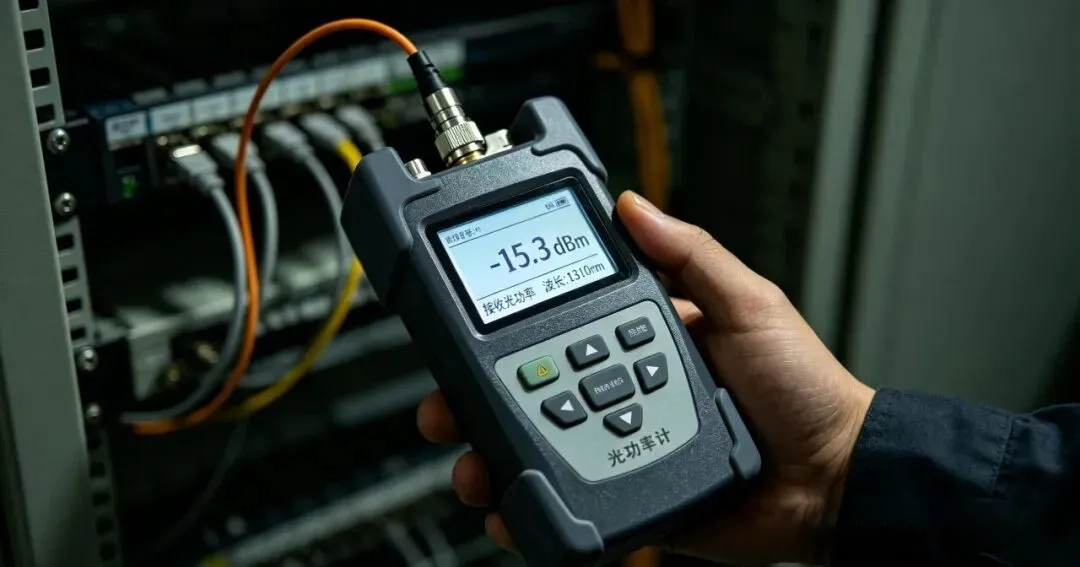
An optical power meter is connected to an optical fiber to receive a signal, and the screen displays a reading of -15.3 dBm.
Standards recognize two versions of this test. A single-ended test (TIA FOTP-171) uses one reference jumper and suits patch cords; reversing the cable tells you which end connector is bad. A double-ended test (TIA OFSTP-14 for multimode, OFSTP-7 for single-mode) adds a receive jumper and measures the whole installed link, which is what handover requires.
A note for multimode testing, because it trips up a lot of people: the light from an LED-style source fills the whole core, and that overfills the fiber with more paths (called modes) than a real laser uses. Standards fix this with mode conditioning, usually a mandrel wrap, which is exactly what it sounds like: a few tight turns of the reference jumper around a rod to strip off the unstable modes. Newer standards ask for "encircled flux" compliance instead, which does the same job inside the source itself. Skip the conditioning and the same cable can read differently every time you test it, so if your multimode numbers wander, this is the first thing to check.
Now let's make that 8.5 dB number mean something. Suppose the cable is 20 km of G.652.D single-mode fiber tested at 1550 nm, with two mated connector pairs and four fusion splices. The math from Corning's test guidelines looks like this:
|
Component
|
Count
|
Allowance
|
Subtotal
|
|
Fiber attenuation (1550 nm)
|
20 km
|
0.22 dB/km
|
4.4 dB
|
|
Mated connector pairs
|
2
|
0.5 dB each (typical)
|
1.0 dB
|
|
Fusion splices
|
4
|
0.05 dB each (typical)
|
0.2 dB
|
|
Loss budget
|
|
|
≈ 5.6 dB
|
Measured 8.5 dB, budget 5.6 dB: the link has almost 3 dB of hidden loss, and something specific is eating it. That's when the three checks come in.
Check stability. Watch the meter for 30 seconds. Movement within about ±0.05 dB is normal; swings beyond ±0.2 dB point to a loose connector or a microbend, in our field experience.
Check consistency. On a multi-fiber link, parallel fibers should read alike. One fiber several dB worse than its neighbors is usually the guilty one.
Check the ends first. Clean both end faces and retest before you blame the cable. In one case we still quote, a customer's 10G link had drifted from -18 dBm to -21.3 dBm received power. Measured loss was 16.3 dB against a 13.0 dB design. Cleaning the optical distribution frame connectors at the local end recovered about 1 dB; cleaning the far end brought the link back to normal. Twenty minutes, two cleaning pens, zero new hardware.
A final trap that catches newcomers: dB and dBm are not the same thing. dBm is an absolute power level (referenced to 1 mW), and it's what the meter shows. dB is a relative difference, and it's what loss is expressed in. Transmitter power minus receiver power gives a loss in dB, never in dBm. Mixing them up makes your numbers meaningless.

4.What Numbers Should a Passing Test Show?
A passing fiber test stays inside the loss budget: TIA-568 allows 0.75 dB per mated connector pair and 0.3 dB per splice, while G.652.D single-mode fiber adds roughly 0.36 dB/km at 1310 nm or 0.22 dB/km at 1550 nm. Multimode OM4 adds about 3.0 dB/km at 850 nm.
|
Component
|
TIA-568 maximum
|
Realistic field value
|
|
Mated connector pair
|
0.75 dB
|
0.3-0.5 dB for adhesive/polish connectors
|
|
Fusion splice
|
0.3 dB
|
0.1-0.2 dB (good work lands near 0.05)
|
|
Mechanical splice
|
0.3 dB
|
0.3 dB
|
|
Single-mode fiber (1310/1550 nm)
|
~0.4 / 0.3 dB/km
|
0.36 / 0.22 dB/km for G.652.D
|
|
Multimode fiber (850/1300 nm)
|
3.5 / 1.5 dB/km
|
3.0 / 1.0 dB/km for OM4
|
The maximum column comes from the TIA-568 loss limits, and the realistic column reflects FOA field guidance. The ITU-T G.652 recommendation defines the single-mode fiber classes behind those attenuation numbers.
Add the pieces, then add a small safety margin, and that's your budget. Two readings on the same cable are both "correct" and mean different things: 5.5 dB passes a 5.6 dB budget but leaves nothing in reserve, while the same reading on a link budgeted for 10 dB suggests something is wrong with your reference or your math, not the fiber.
Short links get tight budgets, so the math is worth doing even for a 100-meter data center run. Take 100 m of OM4 at 850 nm (about 0.3 dB of fiber) plus two mated pairs (about 0.5 dB each with realistic connectors) and you're at roughly 1.3 dB before any margin. That's the whole allowance, and it's why a single dirty end face can fail a link that's only as long as your arm. Long-haul budgets stretch across kilometers, but inside a building, every fraction of a dB is contested territory.
Remember the receiving end too. The optical transceiver modules at each end only care that enough light arrives, so a link can sit inside its paper budget and still starve a receiver on a cold morning. That's why stability over time matters more than any single reading, a theme we return to at the end of this guide.

5.How Does an OTDR Test a Fiber Optic Cable?
An OTDR tests a fiber optic cable by sending a short, powerful light pulse down the fiber and reading the faint light that scatters back. The result is a picture of the whole link: total length, attenuation, every splice and connector, and the exact distance to any break.
It works like radar. A small share of light scatters back from the glass itself (Rayleigh scattering), and reflections bounce back from connectors and breaks (Fresnel reflections). By timing the returns, the instrument plots power against distance. VIAVI's OTDR overview sums up its three jobs: certify new links, maintain them, and troubleshoot faults.

What an OTDR is brilliant at:
Finding where a break or bad splice sits, to the meter, on a 40 km link.
Verifying every fusion splice individually, which loss testing can't do.
Creating permanent trace files for documentation and future comparison.
What it can't do: measure true end-to-end insertion loss on short links, see light past its own dead zones, or tell you anything about the transmitter. That last point is why Tier 1 certification (loss, length, polarity with an OLTS) is required for handover, while the OTDR is the optional Tier 2 add-on. Belden puts it plainly: OLTS is the most accurate way to verify total insertion loss, and it's what acceptance testing should rely on.
Short building cables are the OTDR's weakest case. The FOA notes that premises-length fibers fall inside the instrument's resolution limits and produce confusing ghosts. Below about a hundred meters, trust the meter and the microscope instead.

6.Which OTDR Settings Change Your Results Most?
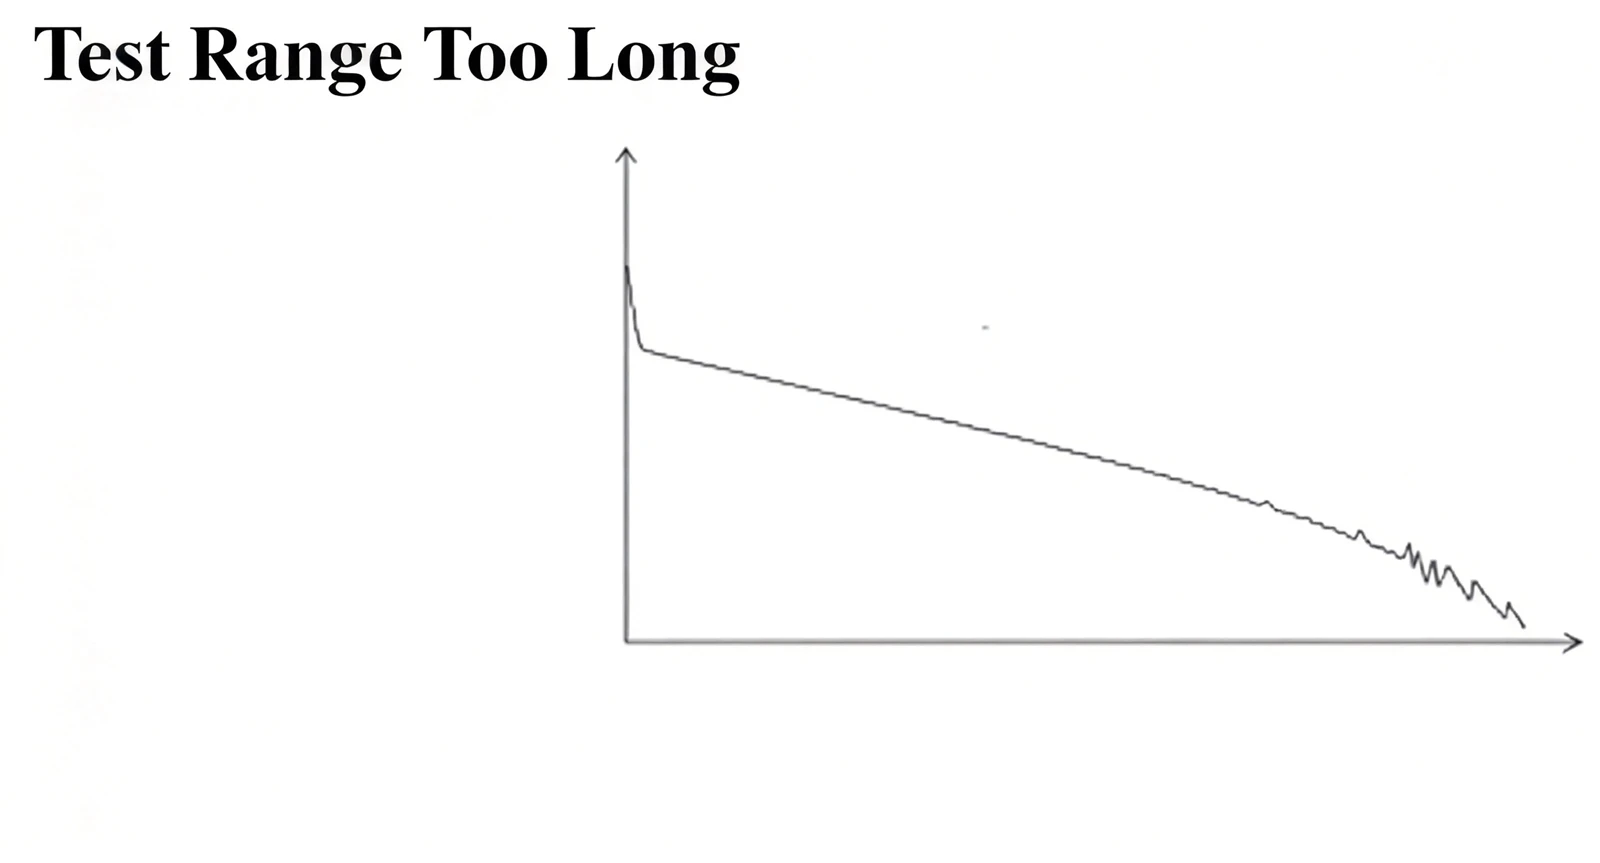
Four OTDR settings decide your data quality: wavelength (test 1310 and 1550 nm together), pulse width (short for detail, long for distance), range (set it to 1.5-2 times the link length), and the refractive index, where a 0.01 error shifts every distance by about 1%. Always add launch and receive fibers longer than the instrument's dead zone.
Wavelength. Run both 1310 and 1550 nm on acceptance jobs. At 1550 nm, light leaks much more easily at bends, so a splice that shows extra loss only at 1550 nm is a bend, not a splice problem. If the link carries live traffic, use the filtered 1625 or 1650 nm port so your test pulse doesn't disturb the signal (and so the traffic doesn't skew your trace).

Pulse width. Long pulses travel farther and drown noise, but they blur nearby events and enlarge the dead zone. Short pulses do the opposite. The field routine that works: run an automatic scan first, then retest near-end events with the shortest usable pulse.
Range and averaging. Set the range to 1.5-2 times the link length; too small and you never see the far end, too large and the trace compresses into mush. Longer averaging (tens of seconds) cleans up noise, especially with short pulses or long spans.

Refractive index (IOR). The instrument converts time to distance using the fiber's IOR, so it must match the fiber datasheet. A 0.01 error moves every reported distance by about 1%, which is 200 m on a 20 km link.
Launch and receive fibers. Every OTDR has a dead zone after a strong reflection where it can't see events. Event and attenuation dead zones hide near-end connectors, sharp bends, and even fiber ends. A launch cable between the instrument and the link lets the first dead zone burn out in the launch fiber instead, and a receive cable at the far end lets you verify the last connector. The FOA's OTDR guide treats the launch cable as mandatory practice, and so do we.
Auto mode versus manual mode. Modern instruments analyze traces automatically, and for routine acceptance it's a genuine time-saver. But the FOA warns that running auto tests without understanding what the instrument is doing leads to problems, and field work proves it weekly. Two manual habits cover the gap: switch to the shortest pulse and manual cursor placement when two events sit close together, and use the live (real-time) trace while a splice is being made to watch it improve as the splicer works. Acceptance reports deserve a human eye on the curve, not just the machine's summary.
Five field mistakes cause most bad OTDR data, so run this checklist before you trust a trace:
Testing with a short jumper instead of a proper launch fiber (near-end events vanish).
Judging splices from one direction only (more on that in the next section).
Testing a live link without the filtered port (distorted data, and you can damage the detector).
Looking into a fiber before confirming it's dark (invisible laser light, real eye risk).
Deleting traces after the test (save the raw files; you'll want them later).
7.Reading the Trace: Five Events and Two Traps
A normal trace reads left to right: a launch reflection, a long gentle slope (that's the fiber's attenuation), event marks along the way, and a final peak at the far end. Total loss divided by total length gives you the average dB/km for the run. Once you know that shape, five event types cover almost everything you'll meet.
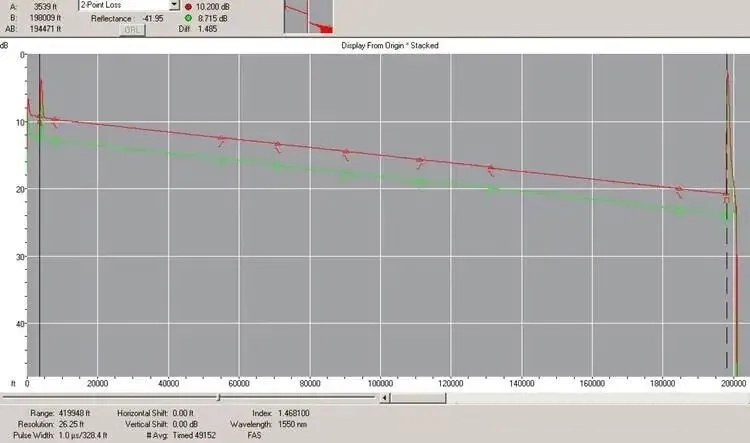
A dual-wavelength OTDR trace for a trunk line: comparing the 1310 nm and 1550 nm curves serves as a key basis for distinguishing between macro-bends and splice events.
Non-reflective events. Fusion splices and microbends show as small steps down with no spike. Good fusion work sits around 0.02-0.05 dB.

Reflective events. Connectors and mechanical splices show a spike plus loss. The taller the spike, the cleaner (and more reflective) the glass-to-air surface.

Macrobends. A step that is much worse at 1550 nm than at 1310 nm is a bend. The fiber isn't broken; it's leaking.

Pseudo-gainers. A splice that appears to gain light. Two fibers with different backscatter characteristics fool the instrument; measured from the other end, the same splice looks like a loss. Bidirectional testing and averaging cancel it out.

Fiber end. A clean break reflects and shows a tall peak. A peak that's missing, with the line dropping steeply before the expected length, means a broken or crushed fiber at that point.

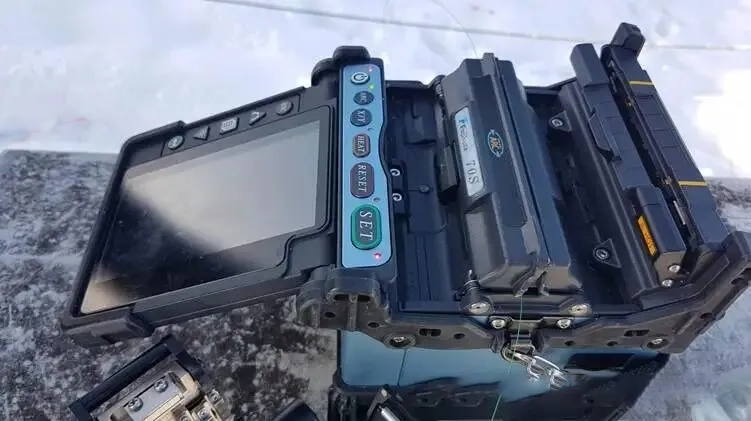
At a fiber-optic splicing work site, a splice point is the most common non-reflective event on an OTDR trace; the loss at this point is a key metric for acceptance testing.
And the two traps. Ghosts are phantom events caused by light bouncing repeatedly between strong reflectors. They repeat at even spacing and shift position when you change the pulse width or range; real events stay put. One-way judgments are the subtler killer: accepting or rejecting a splice from a single trace direction. The gainer effect means one direction flatters a bad splice and another exaggerates a good one, so acceptance reports should always average both directions.
|
What you see on the trace
|
What it usually means
|
What to do
|
|
Small step down, no spike
|
Fusion splice or microbend
|
Compare both wavelengths and both directions
|
|
Step much worse at 1550 nm
|
Macrobend
|
Re-route or re-pad the bend
|
|
Spike with loss
|
Connector or mechanical splice
|
Inspect and clean the end face
|
|
Step up ("gain")
|
Different fibers joined; gainer effect
|
Average bidirectional results
|
|
No end peak, line drops early
|
Broken or crushed fiber
|
Locate with OTDR, confirm with VFL
|
|
Evenly spaced repeating marks
|
Ghosts
|
Change pulse width or range to confirm
|
Trace reading is the skill that takes longest to build from text alone, so here is a full training session: EXFO, whose instruments we reference throughout this guide, published this in-depth session covering trace analysis and interpretation, from dead zones and ghost events to acceptance decisions:
Video: OTDR Trace Analysis and Interpretation, courtesy of EXFO (49 minutes, 1 second). If the player doesn't load, watch it on YouTube.
8.When Should You Test a Cable on the Reel Instead of After Installation?
Test fiber on the reel before pulling it whenever the cable matters. A reel test confirms delivered length, continuity, factory defects, and average attenuation in minutes, and it catches shipping damage before that damage becomes a buried fault you chase for days.
The FOA makes the same argument for the simplest version of the test: checking fiber on the reel with a visual tracer before pulling it verifies the shipment survived the journey. A full reel acceptance adds three numbers to record:
Reel length, from an OTDR measurement, compared to the delivery note.
Continuity, on every fiber, not a sample of them.
Average attenuation, in dB/km, compared to the datasheet.
Short pulse, fast averaging, and you're done in minutes per reel. If a fiber is short or lossy at the reel stage, you just refused a delivery instead of discovering it after two days of installation and a week of finger-pointing.
In our own factory, incoming fiber is tested on arrival and outgoing cable assemblies are tested again before packing, so the reel test also tells you whether your supplier did their job. Ask for reel-level test reports with your orders; a supplier who tests willingly will send them, and our certifications exist precisely so buyers can verify that kind of claim.
9.Is the End Face the Real Problem? The Test Before Every Test
Inspect the connector end face before every fiber test. Contamination is the leading cause of fiber failures, and a single dirty end face can add a decibel or more of loss. IEC 61300-3-35 defines the pass and fail zones, so inspect, clean if needed, and inspect again before you connect.
Here's the scale of the problem. A single-mode fiber core is about 9 microns wide, roughly a tenth of a human hair. A dust particle or a fingerprint's oil film is bigger than the core itself, and the ferrule picks up oil from a single fingertip touch. VIAVI's inspection guide is blunt about it: contamination is the number one cause of fiber network degradation.
That's why professionals follow the inspect-and-clean workflow every time:
Inspect the end face with a scope. If it's clean, don't touch it.
Clean only if contamination shows. Use a one-click cleaning pen or lint-free wipes with pure isopropyl alcohol. Never regular tissues; they shed fibers.
Re-inspect to confirm. Then connect, and only then.
IEC 61300-3-35 turns "looks clean" into a measurable pass or fail. The standard divides the end face into zones (the core, the cladding, and the adhesive/contact area) and limits the size and number of defects and scratches in each zone, separately for single-mode and multimode connectors. Modern video scopes apply the criteria automatically in about a second, which removes human judgment from the decision.
Inspecting before mating also protects the hardware. Mating a dirty connector transfers contamination to the good one, and a particle pressed between two end faces can scratch both, turning a 30-second cleaning job into re-termination.
One safety rule that outranks all of the above: never look into a fiber that might be live. Test light and network light are both invisible. Confirm the fiber is dark with a power meter or live fiber detector before you put a scope or your eye anywhere near it. The FOA's safety guidance says the same, and microscope lenses concentrate any light straight into your eye.
If you want to go deeper on end faces, polishing angles, and why APC connectors are green while UPC are blue, our APC vs UPC end-face guide covers it, and our fiber optic connectors ship inspected and capped.
10.A Complete Test Routine You Can Copy, Start to Finish
Every method in this guide slots into three routines. Steal them, print them, laminate them for the toolbox; a fixed routine is what separates data from anecdotes.
Before the cable is even pulled (acceptance at the dock):
Look over each reel for physical damage, then run a VFL or tracer check for continuity.
OTDR one reel per batch: confirm length matches the delivery note and attenuation matches the datasheet.
File the traces. If a reel fails here, it goes back to the supplier, not into your conduit.
At handover (the numbers that get signed):
Calculate the loss budget for every link and put it in a spreadsheet before testing anything.
Inspect and clean every end face; confirm the fiber is dark before scoping anything.
Run the OLTS test at both wavelengths, both directions if the standard asks for it.
Add an OTDR trace on links with splices or longer than about a kilometer, with launch and receive fibers.
Save raw results with link names and test directions, then compare every reading against the budget from step 1.
When something breaks (troubleshooting, in order of cost):
VFL and end-face inspection first; they fix most problems for free.
Power readings at both ends next; a 3 dB drop against last month's log is your clue.
OTDR last, to convert a symptom into a location you can walk to.
Notice the pattern in all three: cheapest and fastest checks come first, expensive instruments come last. We test thousands of assemblies a week in our factory, and the routine never changes order, because it works.
11.How Do You Test an MPO Cable? 8-Fiber vs 12-Fiber and Polarity
To test an MPO cable, verify polarity first, then measure loss either with an MPO-capable tester or through an MPO-to-LC breakout cord. An 8-fiber cable reuses positions 1-4 and 9-12 of the standard 12-fiber connector, so a cable that tests perfectly can still fail the link if polarity maps transmit to transmit.
MPO changes the testing game because one connector carries many fibers. Where an LC link has one pair to check, an MPO trunk may have 8, 12, or 24, and polarity (which fiber carries transmit versus receive at each end) is decided inside the cable, not at the equipment. Polarity types A, B, and C each map the fibers differently, and a mismatch sends every signal into a receiver that isn't listening.
8-fiber vs 12-fiber at a glance:
|
Feature
|
8-fiber (Base-8)
|
12-fiber (Base-12)
|
|
Active positions on the connector
|
1-4 and 9-12
|
All 12
|
|
Middle four fibers (5-8)
|
Unused by 8-fiber optics
|
Active
|
|
Built for
|
4-lane optics (40G/100G SR4)
|
Legacy and parallel 12-lane links
|
|
Waste
|
Minimal
|
4 idle fibers when running SR4 optics
|
|
Forward compatibility
|
Limited toward 16/24-fiber
|
Broad, common in Base-12 estates
|
The background is simple: 40GBASE-SR4 and 100GBASE-SR4 send on four fibers and receive on four, eight in total. On a standard 12-fiber MPO connector, that leaves the middle four fibers idle, which is why dedicated Base-8 cabling exists for all-SR4 environments. Most data centers, though, carry years of Base-12 infrastructure, and conversion patch cords let Base-8 optics run on Base-12 trunks without wasting fibers. If your estate mixes both, every test report should say which scheme each trunk uses.
Now the actual testing. Two workable methods:
Breakout method. Attach an MPO-to-LC breakout to each end and test fiber by fiber with a standard light source and power meter. Slow but thorough, and it works with equipment you already own.
Loopback method. For single-ended checks on one trunk, loop the far side back with an MPO loopback module so transmit lands on receive, then scan all fibers from one end. Quick, and it needs only one person.
MPO-native method. Use an MPO tester that measures all 12 fibers in one operation, verifying polarity and loss in a single pass. For high-volume data center work, this is the only sane option.
Whichever method you choose, test every fiber. Testing 4 of 12 and assuming the rest is how a single dead lane ships inside a certified-looking trunk. For a fuller walkthrough, see our complete MPO cable guide, our fiber core count guide, and the MPO trunk cables we manufacture for 400G and 800G AI data center builds, where DAC and AOC cables often handle the shortest racks.
We learned the polarity lesson the hard way, so you don't have to. On an early AI data center project, a full MPO trunk "failed" acceptance twice. The cable was fine; the harness at one end used a different polarity method than the cassette it plugged into. Forty-five minutes of testing proved the cable, and one swapped harness fixed the link. Test polarity as a test, not as an assumption.
12.How Do You Know a Test Result Deserves Trust?
Trust a fiber test when the reading is stable, repeatable from both directions, and archived with its settings. A healthy meter holds within about ±0.05 dB over 30 seconds; drift beyond ±0.2 dB points to a loose connector or a microbend. Keep the raw traces, because trends reveal what single readings hide.
Stability comes first. Watch any reading for 30 seconds before writing it down. A steady link barely moves; a link with a microbend or a half-seated connector wobbles, and its number today is a coin flip.
Repeatability comes second. Splice acceptance should average two directions, since backscatter differences between fiber types fake gains and losses. Insertion loss tests should survive a re-run with re-seated connectors within a few tenths of a dB.
Instrument health comes third. Have meters calibrated annually, check your reference jumpers by testing them alone before every job, and store raw results: modern OLTS save end-face images and loss figures together, and OTDR traces (.sor files) should be saved with the link name, date, and test direction in the filename. Future-you will be grateful.
Then there's the uncomfortable one: not every report is honest. This industry sees copied test files, reports for cables that were never tested, and 4 fibers tested out of 12 with the rest "extrapolated." Write acceptance clauses that make cheating pointless:
Every fiber, both wavelengths, no sampling.
Raw trace or result files attached, not just summary sheets.
Test method (1, 2, or 3-cable reference) documented with the data, as the standards require.
Random retest rights on site.
Finally, treat every reading as one point on a line, not a verdict. If the same fiber read -18.0 dBm last quarter and reads -18.6 dBm today, both numbers pass, but a 0.5 dB trend is a question, and in our experience the answer is usually a dirty end face, not a dying cable. Archive the traces, compare over time, and the fiber tells you it's in trouble long before your users do. That is what our quality control process does batch by batch, and what a good maintenance program does link by link.
13.The Takeaway: Test Like the Link Matters
Learning how to test a fiber optic cable pays off in one afternoon, and the habits last a career. Three things to carry out of this guide:
Match the method to the question. VFL for "is it broken," inspection for "is it clean," light source and power meter for "how much loss," OTDR for "where exactly."
Inspect, clean, and inspect again before every connection, and never look into a fiber you haven't confirmed is dark.
Trust trends, not single readings. Stable numbers, bidirectional averages, archived traces, and honest acceptance clauses are what make a pass mean "pass."
Everything we've covered here is standard practice inside our own production line, from incoming fiber checks to final optical communication products inspection. If you're specifying cable for a project and want the test reports to back it up, fill out the inquiry form below and our engineering team will help you match the right patch cords, MPO trunks, and transceivers to your loss budget. We've spent 20 years making cables that pass the second test, not just the first one.
14.Frequently Asked Questions
Q1. How can I test a fiber optic cable without special tools?
You can check continuity with a visual fault locator, the cheapest fiber tool available, by watching for red light leaking at breaks and bends. A flashlight pointed into one end while you look at the other confirms light passes through. What you can't do without a light source and power meter is measure loss, so treat tool-free checks as triage, not certification.
Q2. What is a good loss reading for a fiber optic cable?
There is no single "good" number; good means inside your calculated budget. As a rule of thumb from the TIA-568 loss limits: 0.75 dB per mated connector pair, 0.3 dB per splice, plus the fiber's dB/km times its length (about 0.36 dB/km at 1310 nm for G.652.D single-mode). A 20 km link with two connectors should land near 5-6 dB at 1550 nm.
Q3. Can you test a fiber optic cable while the network is running?
Yes, with the right equipment and caution. OTDRs with filtered 1625 nm or 1650 nm ports are built for in-service testing and keep your test pulse away from the traffic wavelengths. Never look into a fiber that might be live, and confirm with a power meter or live fiber detector first, because invisible laser light is a real eye hazard.
Q4. Why does my OTDR show a gain at a splice?
That's a pseudo-gainer, not a benefit. Two joined fibers with different backscatter characteristics return different amounts of scattered light, so the trace can step upward across the splice, as OTDR trace guides explain. Measure the same splice from the other end and average the two results; the real loss will be a small positive number.
Q5. How do you test an 8-fiber or 12-fiber MPO cable?
First verify polarity, because an MPO trunk maps transmit and receive internally and a mismatch fails the link even when loss is perfect. Then measure every fiber, either fiber-by-fiber through MPO-to-LC breakout cords or all at once with an MPO tester, and remember that 8-fiber cables leave the middle four positions of the 12-fiber connector idle when running SR4 optics.
Previous:No Information